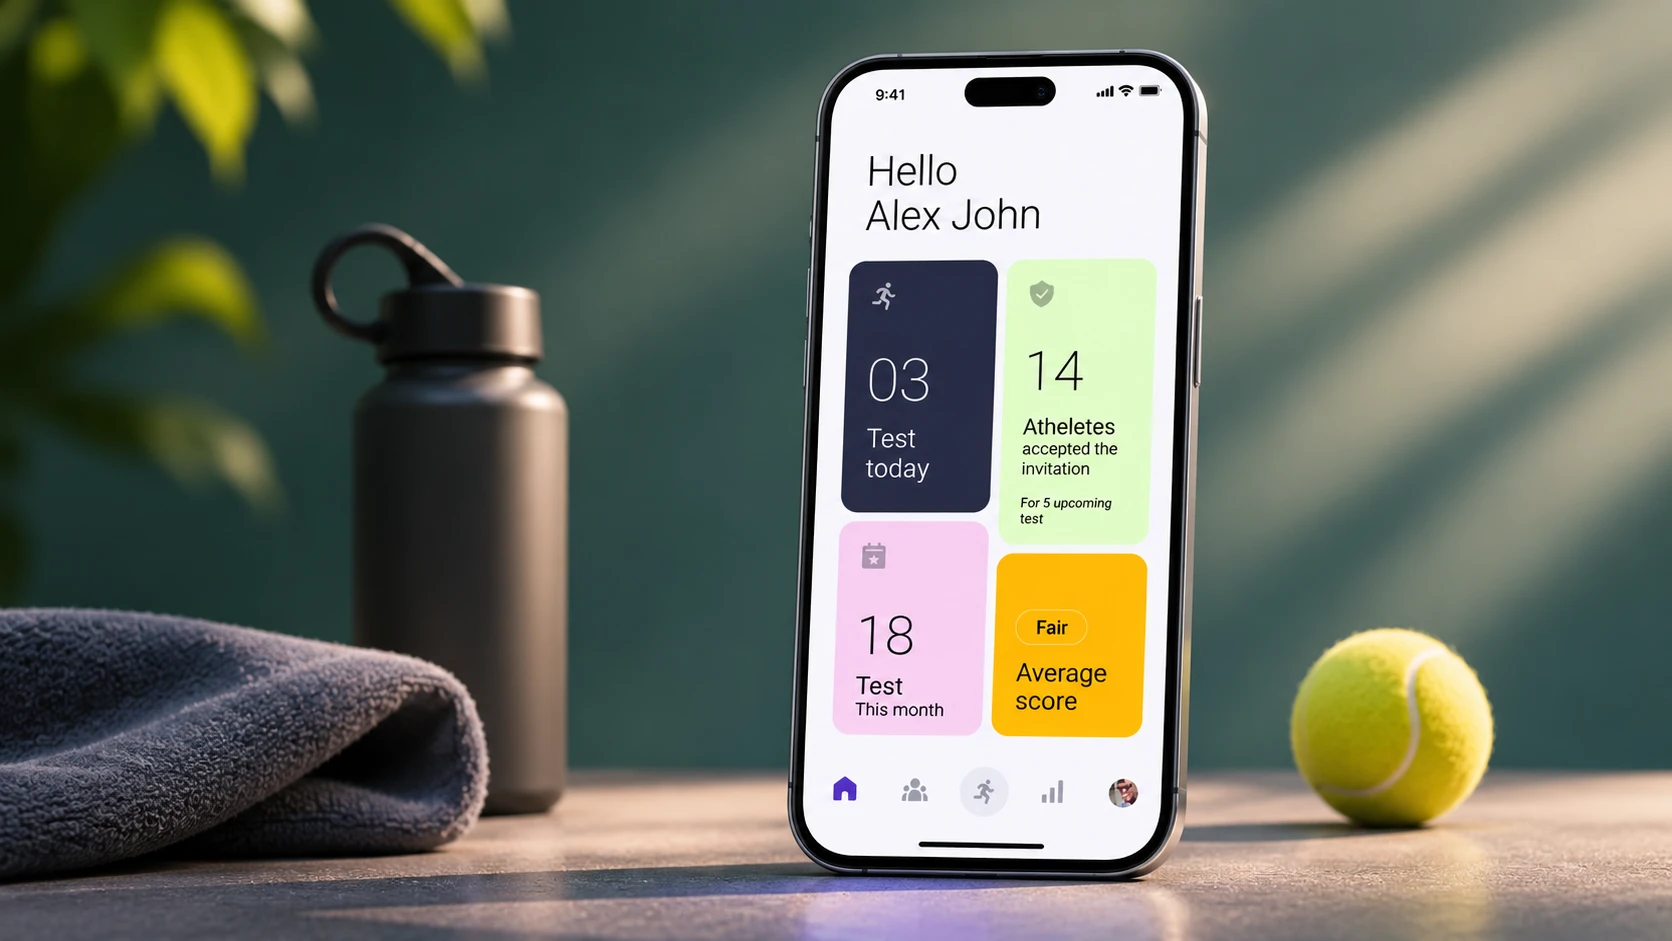
The challengeCoaches record Yo-Yo test results on paper and retype them later. With around 15 athletes running at once, that is slow and easy to get wrong.
What I didI led research with 8 coaches and 12 athletes, mapped the whole test day, and designed one mobile app for both, with phone and manual capture plus team reports.
What happened19 of 25 test attempts succeeded. Core flows worked. Explaining the app and connecting phones failed, and that drove the next iteration.

1. Understand
What the test is
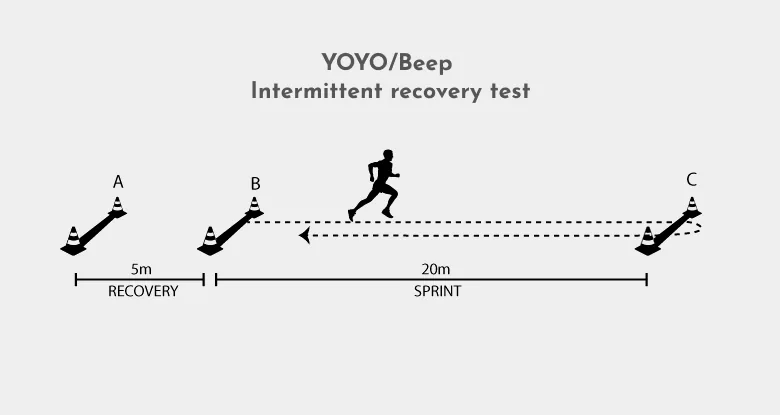
The Yo-Yo test is a maximal aerobic endurance test: athletes run between markers 20 meters apart at increasing speeds until exhaustion. It was developed in the 1990s by Danish soccer physiologist Jens Bangsbo and colleagues, and it is still widely used because it is a great way to measure VO2 max.
The real problem
The test itself works. The system around it doesn't. Athletes also lack exact information about how to do the test on their own premises.
A coach's test day today: six stages, eight tools
Rebuilt from my customer journey map. The coach's emotion peaks negatively at the end, while checking that entered values are correct.
How might we let one coach capture accurate results for 15 running athletes, in real time, without paper?
For users: perform the test seamlessly and effectively.
For the business: 40% of athletes and 35% of sports teams in the world use the product, as a meaningful provider of insights and a companion to coaches and athletes.
How we worked
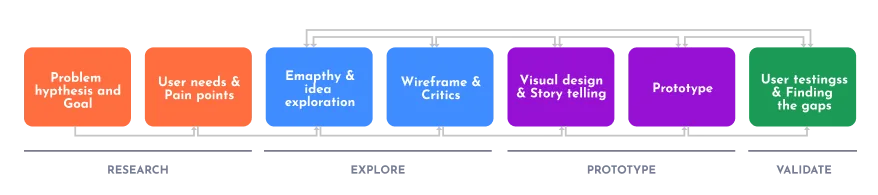
We followed IDEO's Human-Centered Design and Lean UX. With four weeks, we agreed a clear boundary in strategy sessions: a simple solution and minimal research, while still trying new technology.
Research at a glance
Learning the rules
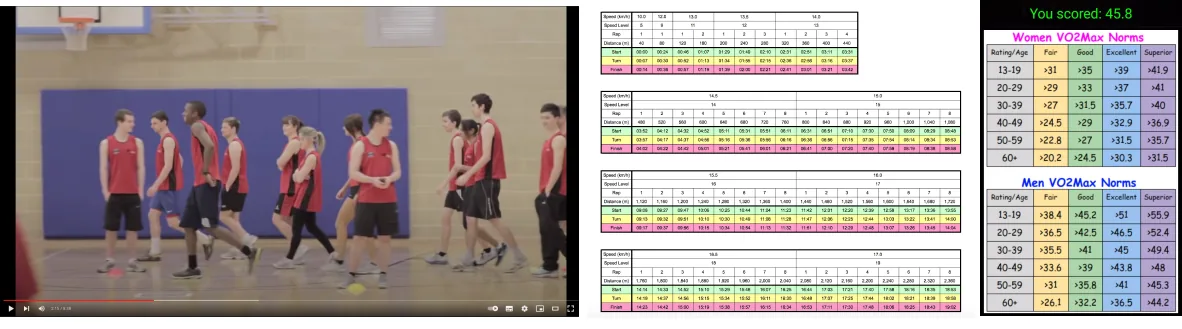
The test is more complicated than it looks: every level has its own shuttles, speeds and calculations. Level 1, for example, has 7 runs of 20 meters, or 140 meters in total.
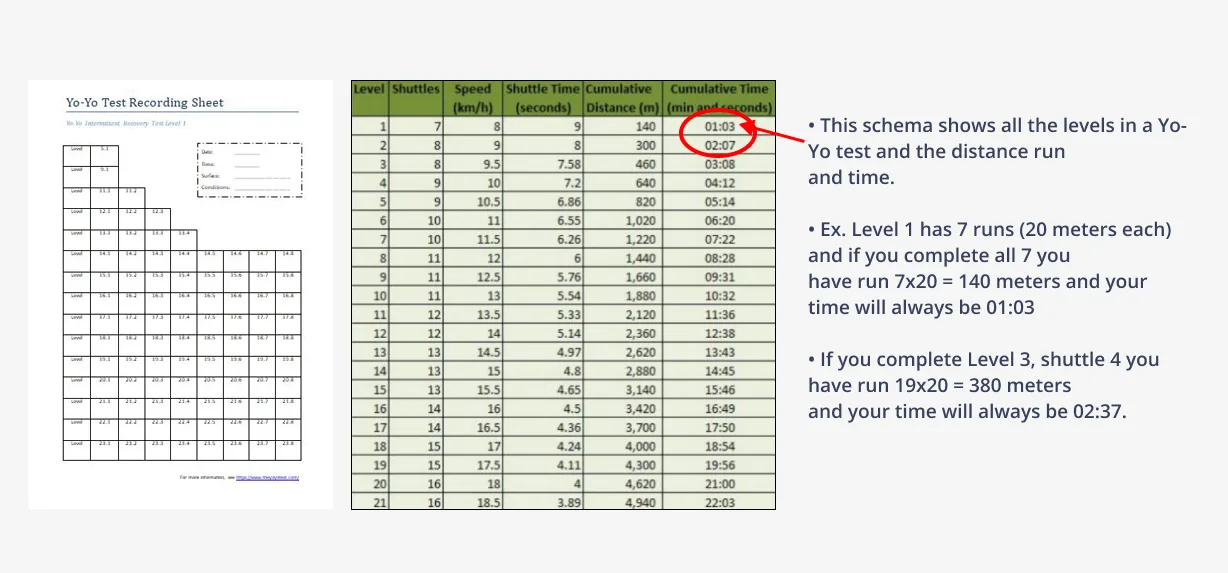
The rule the design has to follow
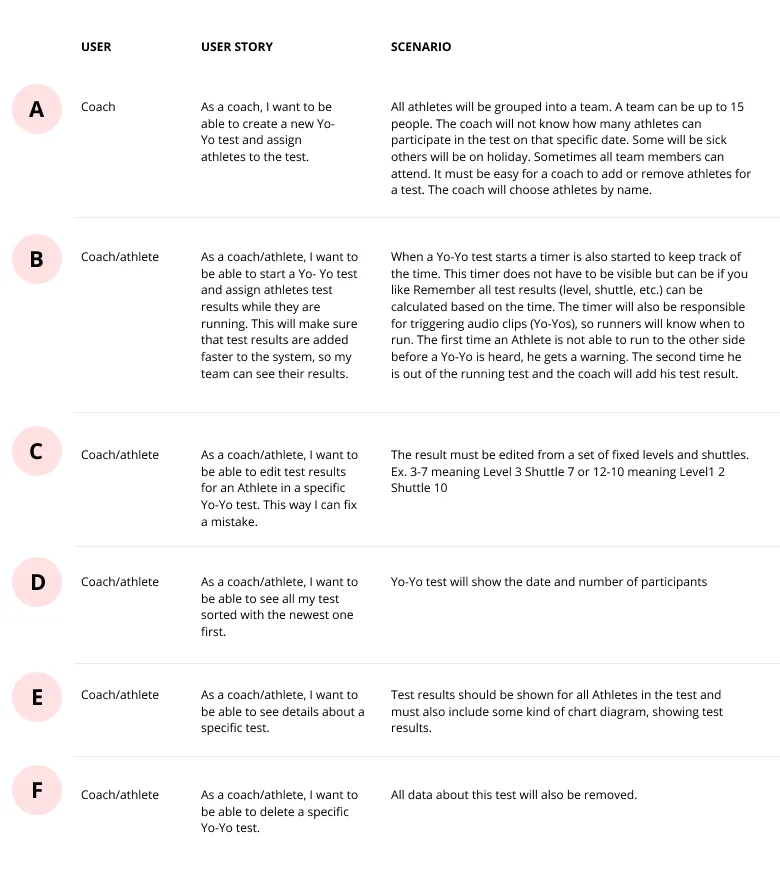
From user story B and C. With up to 15 athletes, this cycle runs in parallel, which is why a coach can't look down at a form for long.
Looking at the market
We compared four apps on usability, interface, features and engagement. Market share data wasn't available, so we judged them on the experience.
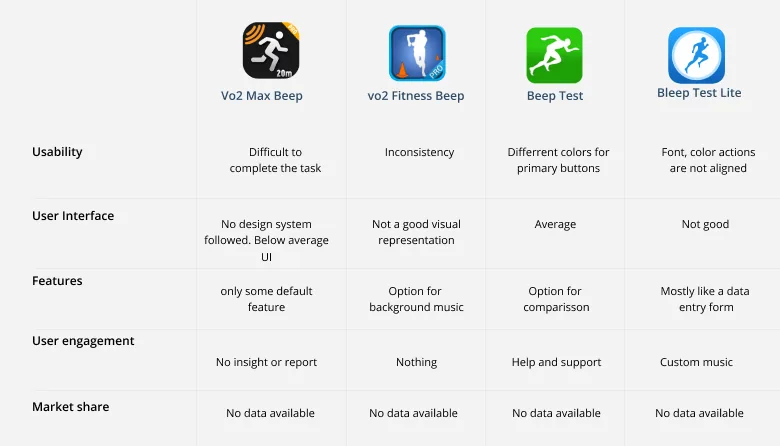
What we learned: The gap was not another timer. Most apps gave coaches no real insight or report.
What it changed: Reports and team-level results became core to the MVP.
Talking to coaches and athletes
I used semi-structured interviews and put time into framing the questions, because the intent behind a question matters before any interview starts.
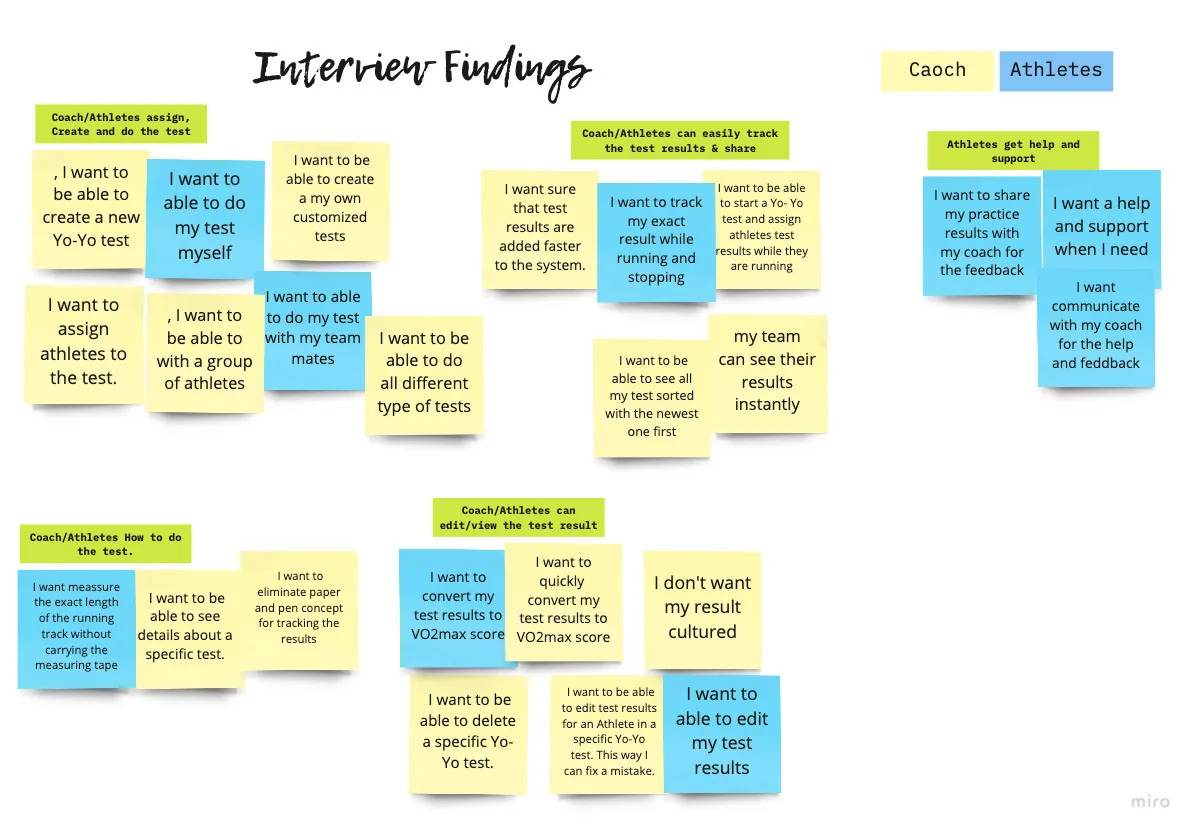
What 24 interview notes clustered into
Yellow notes came from coaches and blue notes from athletes. Representative notes shown; synthesised from the interview board below.
- "I'm always overwhelmed by explaining the same thing again and again"
- "This digital world, we are still using pen and paper for doing the test"
- "I really struggle most of the times to get the small improvements that I did on the self-test"
Trying it myself
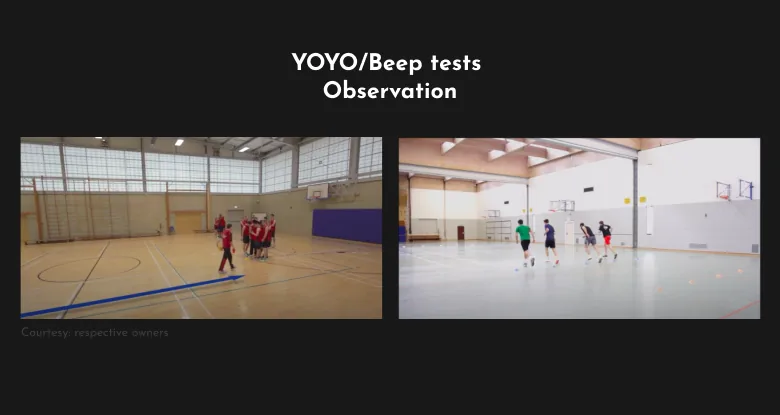
Anybody can do this test, so I tried it with the tools available to feel the experience first-hand.
2. Define
Two people, one journey
We created two primary personas: a coach aged 45 to 50, and an athlete aged 22 to 31.
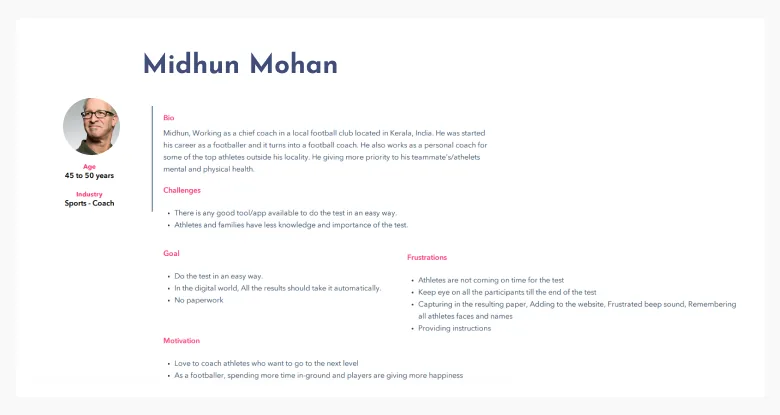
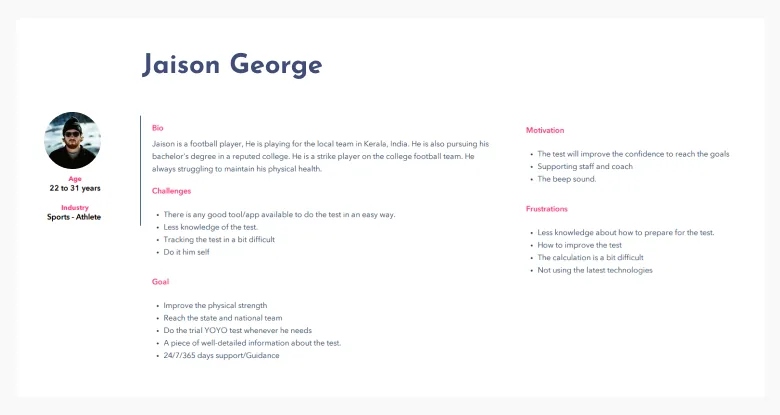
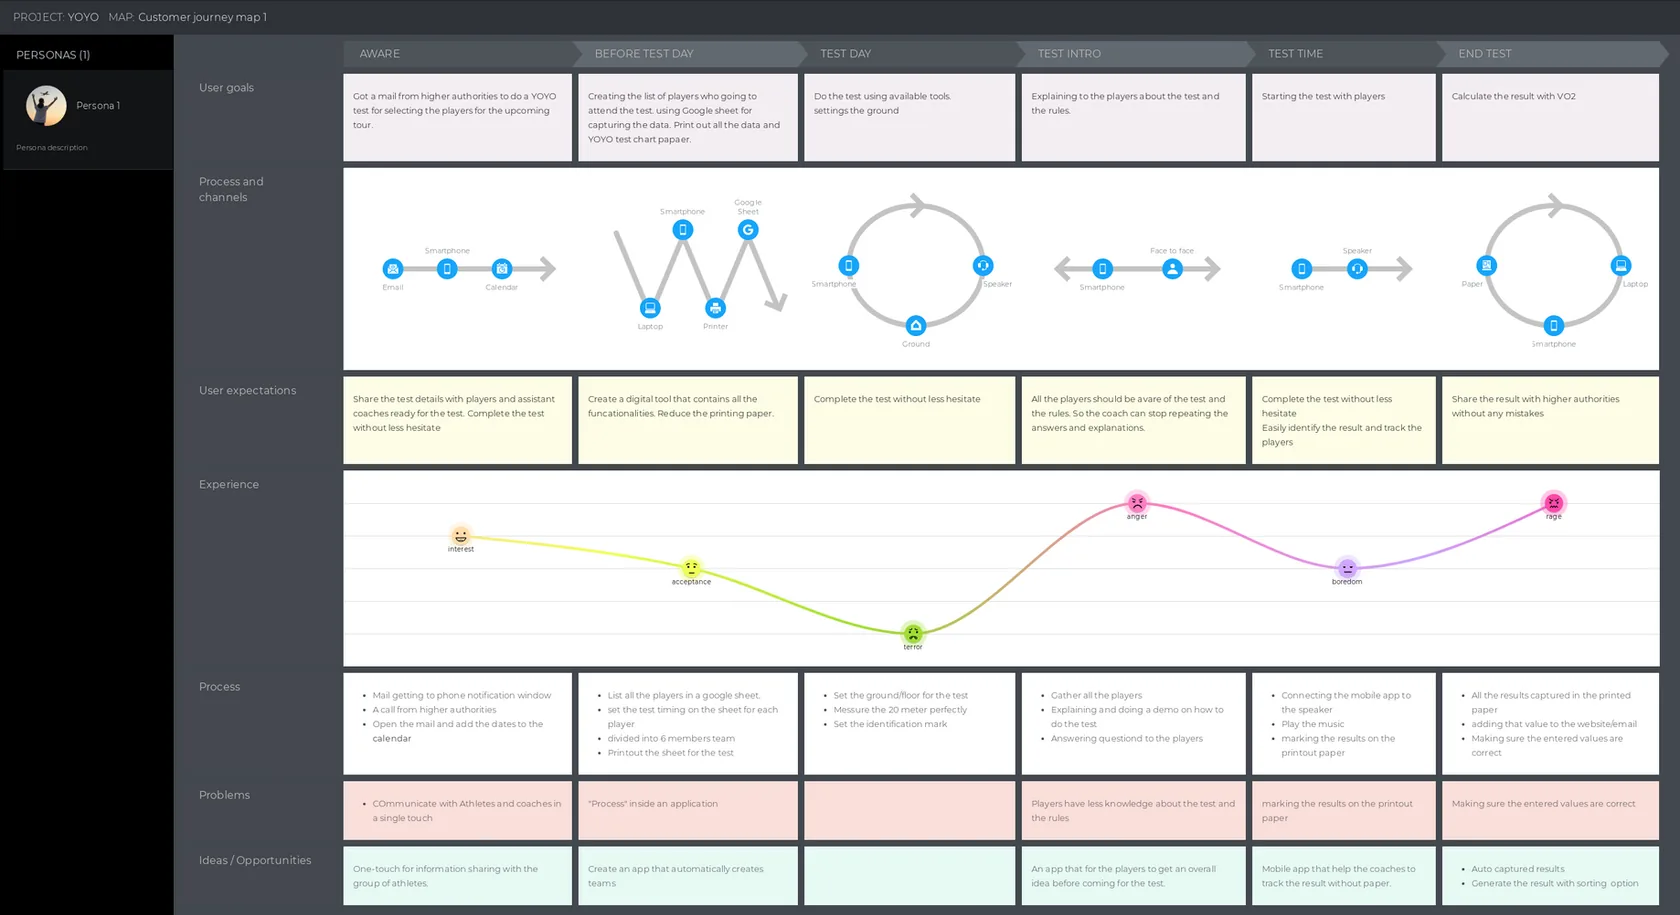
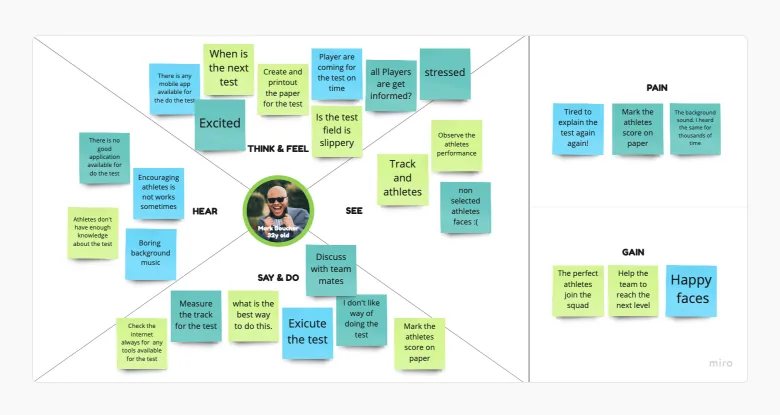
What we learned: Most of the athlete's touchpoints already sit inside the coach's journey, and both need the same test, results and information.
What it changed: We chose one mobile application for both, rather than two products.
The journey showed four specific opportunities:
- An easy way to share test information with a group of athletes
- Create a team from an Excel sheet
- Give players an overall idea before they arrive for the test
- Capture the result automatically and instantly
Design principles
"Work everywhere" came straight from the setting. This app is used on a field or a court, not at a desk.
 Seamless
Each user has their own schedule and habits. The experience should connect with daily life.
 Work everywhere
The design should work in sunlight, at night and under indoor lights.
 Simple
No complicated design or experience.
 Perform automatically
Work in the background with less manual interaction.
3. Ideate
Deciding the MVP
We brainstormed solutions and placed them on a 2x2 matrix.
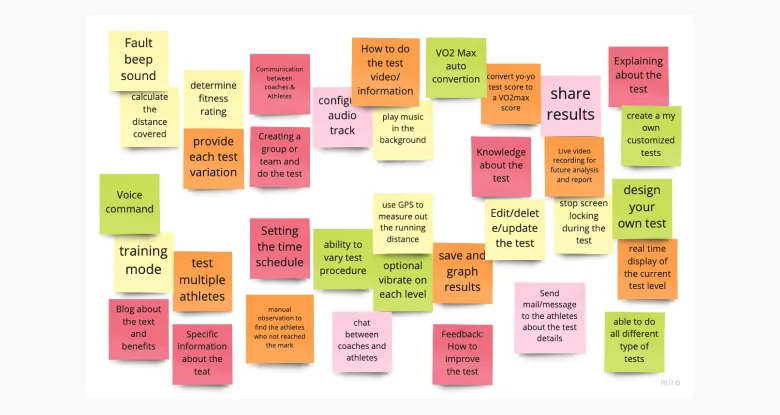
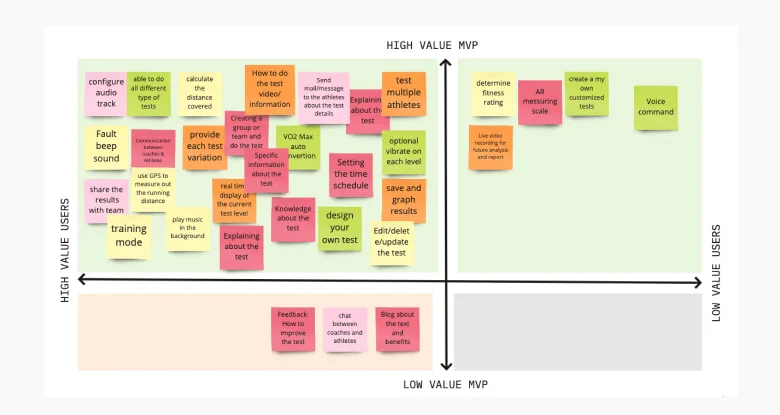
What made the MVP
Selected items, rebuilt from the 2x2 matrix below.
The central decision
Capturing the result is where this product succeeds or fails. Keeping a manual route was deliberate: technology should never stop anyone from doing the test.
How should a result be captured?
| Idea | What it needs | Who records | Decision |
|---|---|---|---|
| Smartwatch | Each athlete owns a watch | Automatic | Later: shown disabled in the prototype |
| Track sensors | Sensors installed on the track | Automatic | Not chosen |
| Manual | Only the coach's phone | Coach | MVP |
| Phone carried while running | Phones paired and carried | Automatic | MVP |
Requirements summarised from each idea. We chose ideas 3 and 4 after voting and a technical feasibility check.
Scenarios and structure
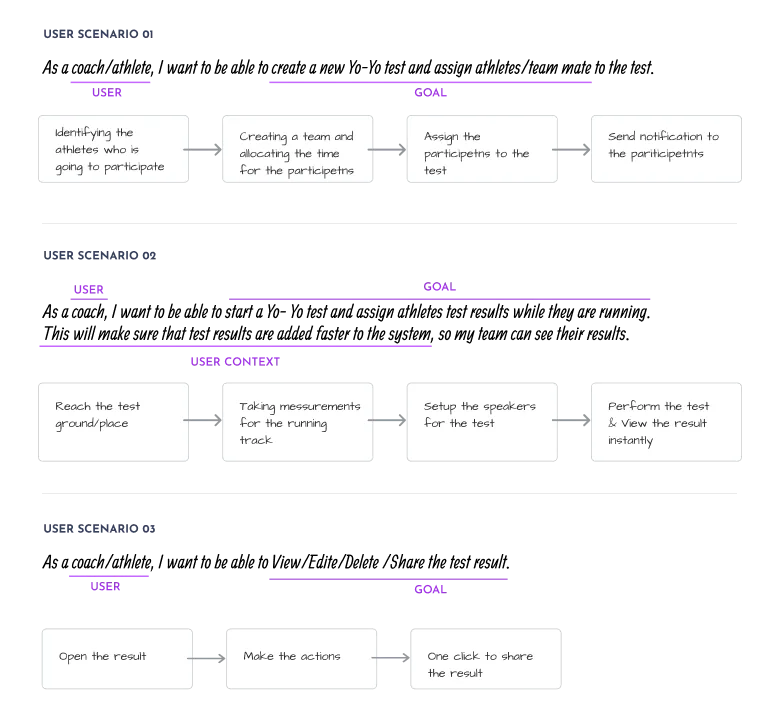
Before any wireframes, I wrote task flows from user scenarios, then we ran workshops to build the information architecture.
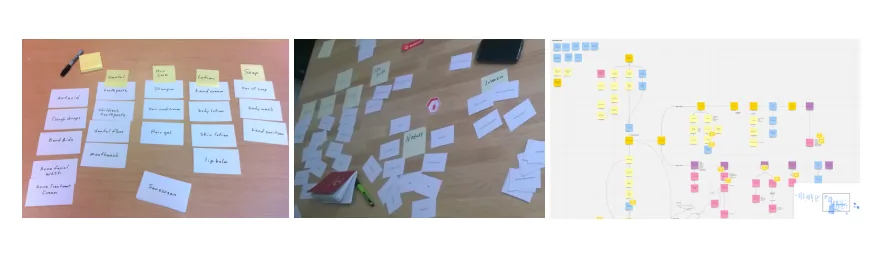
Information architecture
- Hello, name
- Test today
- Athletes accepted
- Tests this month
- Average score
- Team list and members
- Choose test type
- Add a member
- Run with mobile
- Run it manually
- Run with smartwatch
- Live test screen
- Mine / Team
- Filter by test
- Score chart
- Results / Upcoming
- QR code
- Test introduction
- How to do the test
- Settings: music, beep
- Invite
Mapped from the final screens and five-tab navigation. Tab names are descriptive; the app uses icons. Run sits in the centre because it's the primary action.
Storyboards and paper
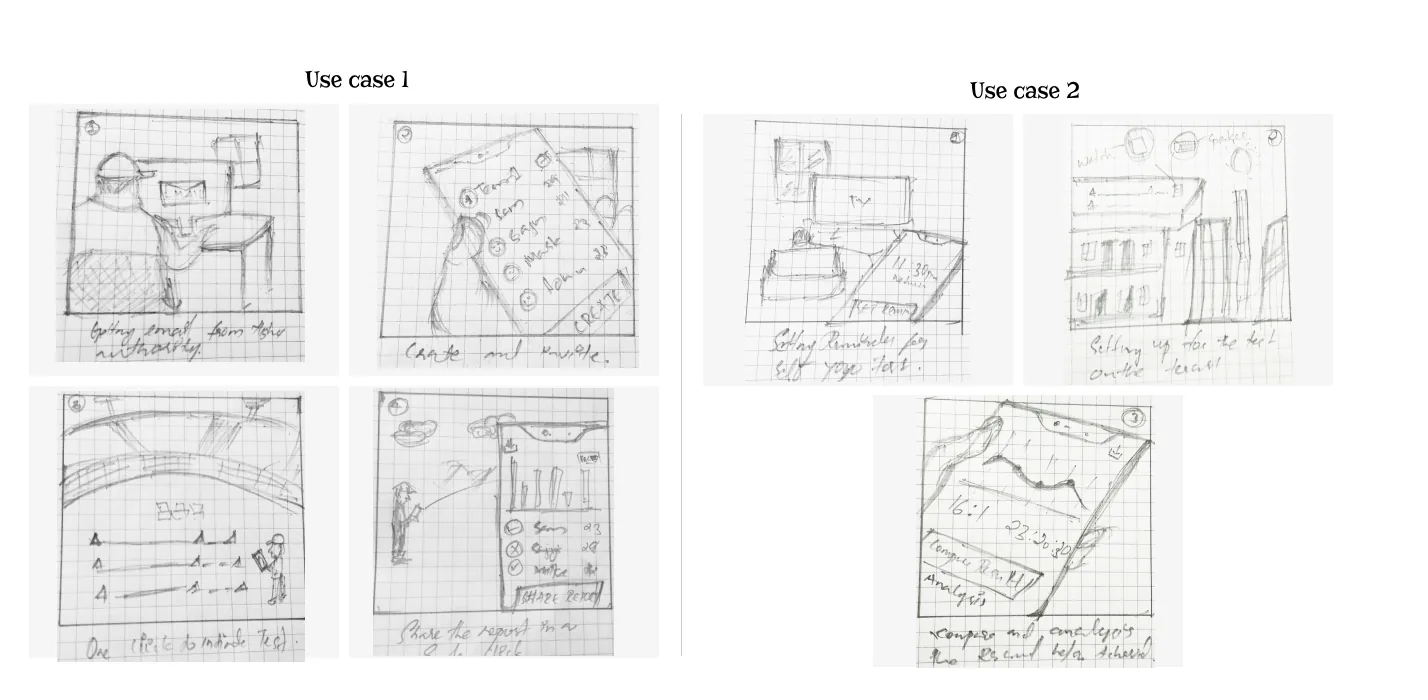
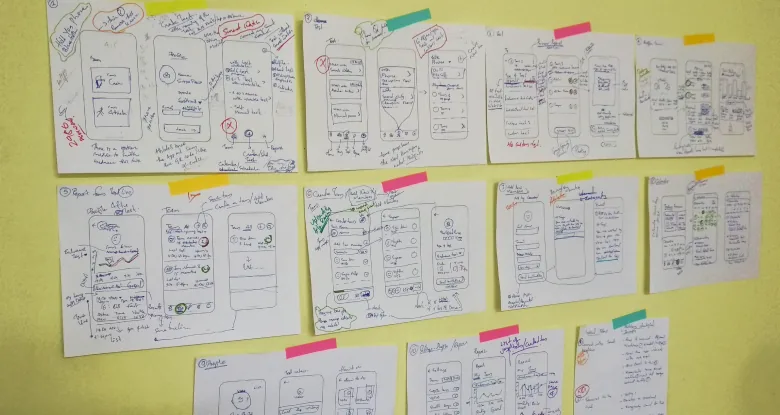
I storyboarded how people would use the app, then made paper wireframes to review with friends and seniors.
4. Design
From role to result
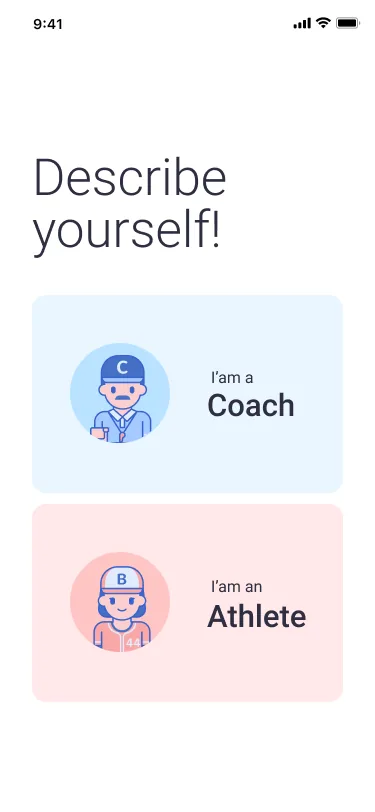
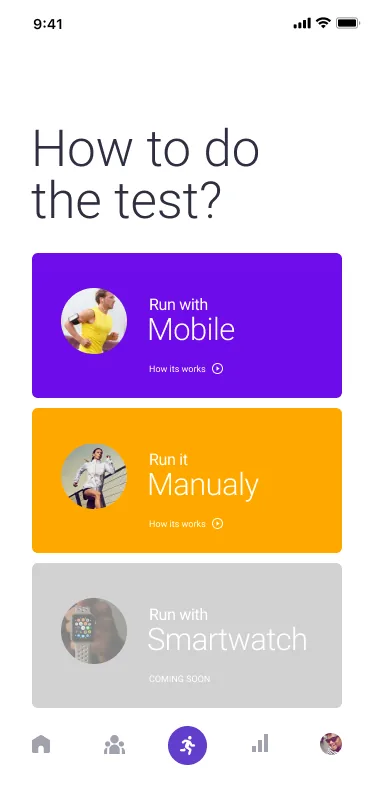
The first screen identifies a coach or an athlete, so the app can send relevant content. The next offers three ways to run the test, so it can always go ahead whatever equipment is available.
Running the test
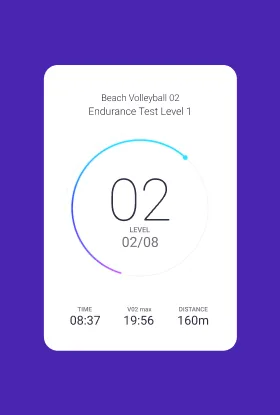
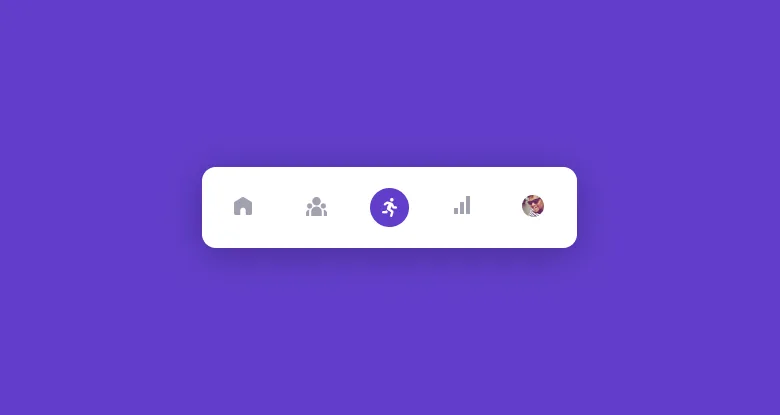
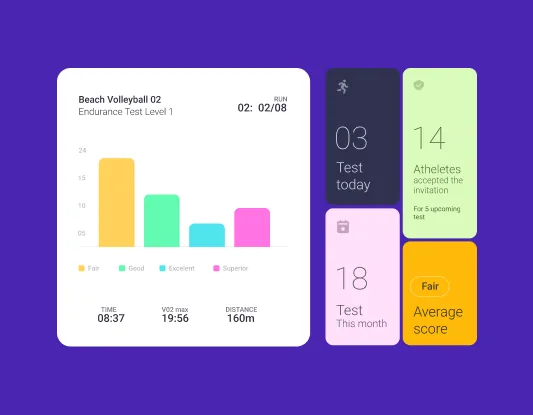
The test screen shows the current level, time and distance in a large, simple layout that can be read at a glance. Run sits at the centre of the navigation because it is the main job.
Profile and report
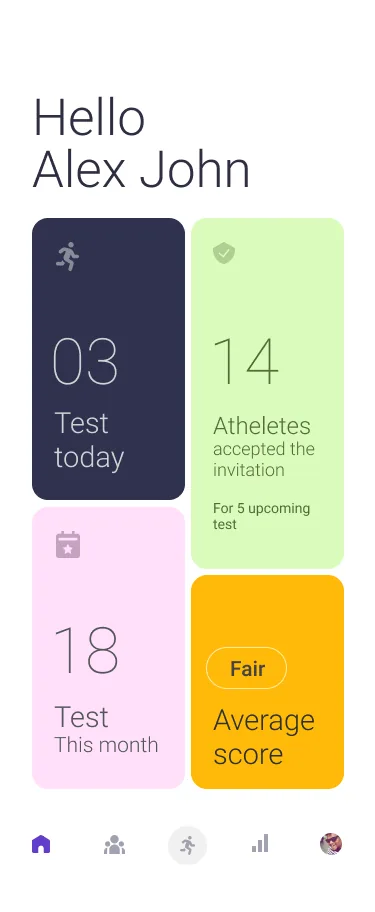
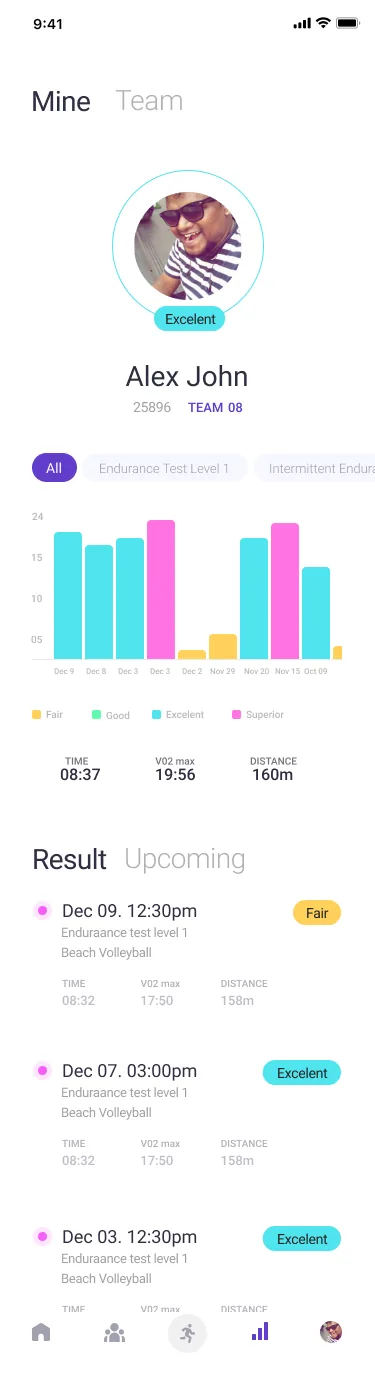
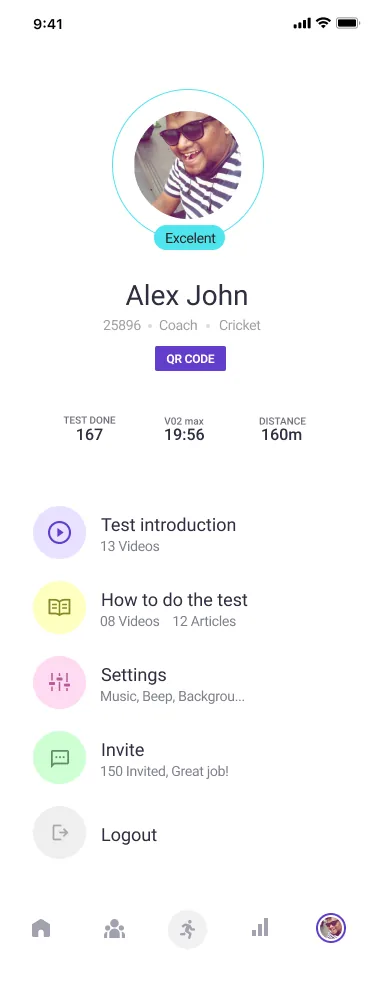
Athletes wanted to see small improvements, so progress is visible from the home screen through to each result. Scroll inside the longer screens to see all of them.
A score scale coaches can read at a glance
Colours sampled from the final UI. White on the app's purple measures 9.6:1 contrast, which supports the Work everywhere principle.
5. Validate
Task testing
We ran a remote moderated test of 5 major functions with 5 users.
Results by task and user
| Task | Athlete 1 | Athlete 2 | Coach 3 | Coach 4 | Athlete 5 |
|---|---|---|---|---|---|
| Understand what the app is | ✓ | ✕ | ✕ | ✕ | ✕ |
| Create a level 1 test and schedule it | ✓ | ✓ | ✓ | ✓ | ✓ |
| Connect your team's phones | ✕ | 2nd try | ✓ | ✕ | ✓ |
| Create and perform a manual test | ✓ | ✓ | ✓ | ✓ | ✓ |
| View your and your team's reports | ✓ | ✓ | ✓ | ✓ | ✓ |
19 of 25 attempts succeeded. Failures sit in two rows, so the problem is onboarding and connection, not the core test flow.
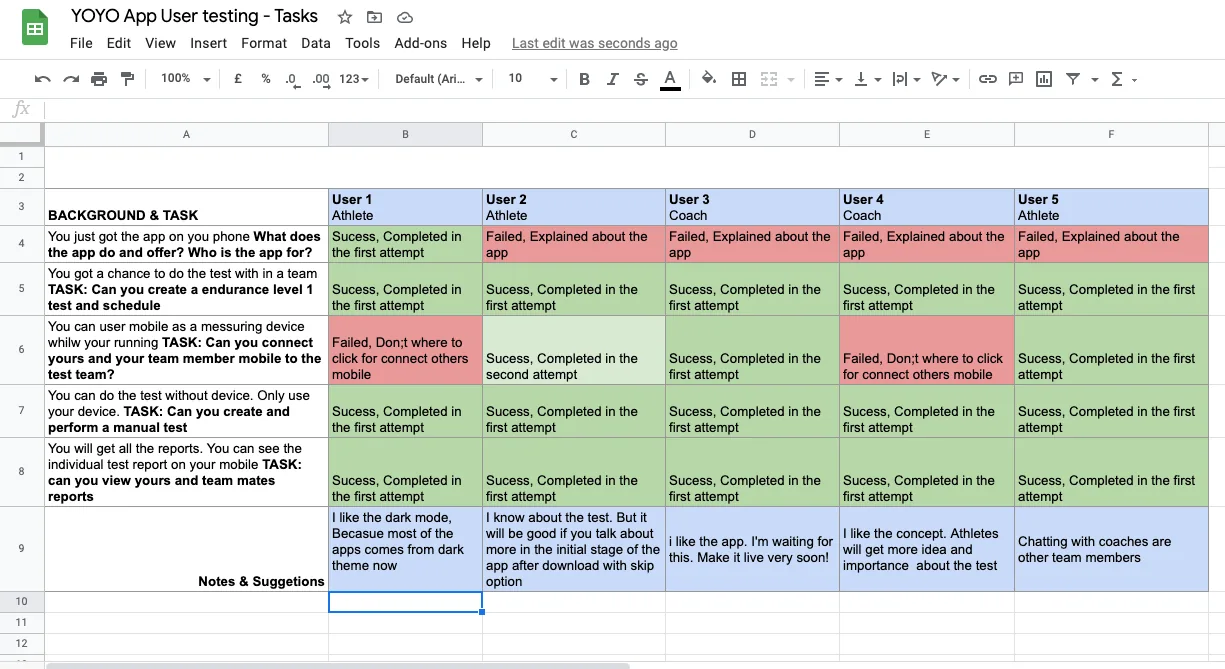
Only one person understood the app without help. One user suggested explaining more early on, with an option to skip.
Testing in the real world
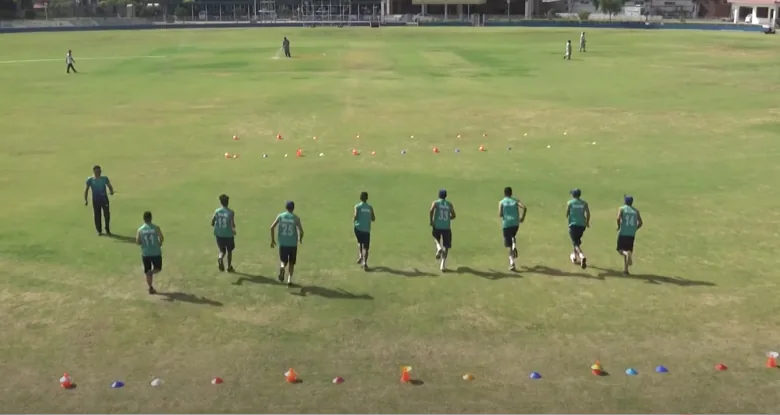
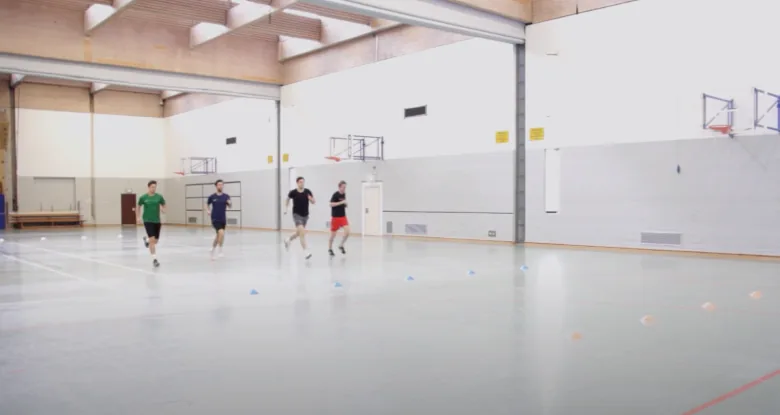
We then tested outdoors and indoors, because a phone on a field behaves differently from a prototype on a call.
From finding to change
| Finding | Design change | Status |
|---|---|---|
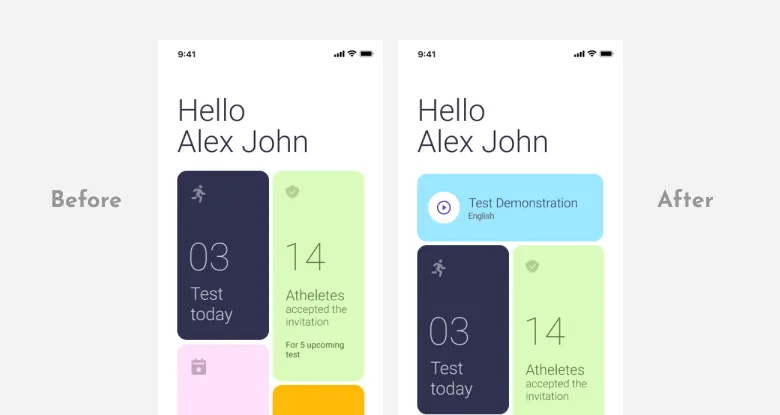
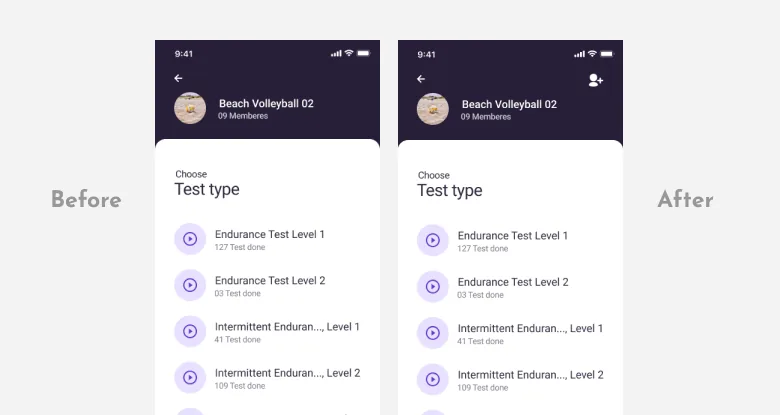
| Coaches keep explaining the same context | Test Demonstration card on the home screen | Designed |
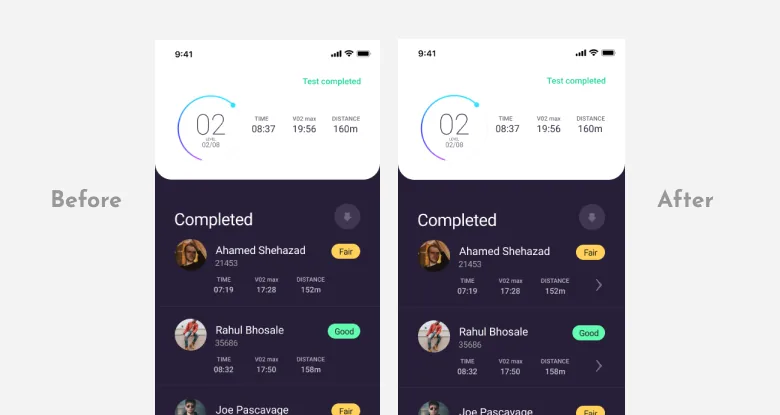
| Coaches can't find individual reports | Each athlete's result leads to their report | Designed |
| Adding a member before starting is hard | Add member action on the test screen | Designed |
| How to carry the phone while running | No change documented | Open |
| Athletes ask how to improve | No change documented | Open |
| Connecting phones failed for 2 of 5 | No change documented | Open |
6. Outcome
What I learned
- Testing can overturn prioritisation. We ranked feedback on how to improve low, and athletes asked for it anyway.
- Brainstorming works best when you know when you actually need a group. With an unfamiliar product, desk research and the people around you build understanding.
- Remote research can cover most of a UX project.
What I'd measure next
Proposed measures for the next round
| Question | Measure |
|---|---|
| Does it beat paper? | Time from test end to all results in the system, compared with paper |
| Is capture accurate? | How often coaches edit a result after the test |
| Is onboarding fixed? | Share of first-time users who can say what the app does |
| Does connection work? | Task success connecting team phones, up from 3 of 5 |
These are proposed measures, not results.